Wednesday, March 30, 2016
Gung Ho! Book and Movie Review
BooK : Gung Ho! Turn On the people in Any Organization
Ken Blanchard and Sheldon Bowles, co-authors of the New York Times business bestseller Raving Fans, are back with Gung Ho! Here is an invaluable management tool that outlines foolproof ways to increase productivity by fostering excellent morale in the workplace. It is a must-read for everyone who wants to stay on top in today's ultra-competitive business world. The authors describe three distinctive phase of transforming a traditional organization to an organization based on high performance work team.
Movie: Gung Ho (1986) (112 minutes)
When a Japanese car company buys an American plant, the American liason must mediate the clash of work attitudes between the foreign management and native labor. This is the trailer on Youtube.
Monday, March 28, 2016
Why Lean Starts in the Bathroom
In this video, you'll learn why the President of a Lean Thinking company believes the secret to their success can be found in their bathrooms. He said that it's the clearest path in the world. It's cleaner better than the ritz carlton. He mentioned that it's sparkling clean.Here is another video about lean bathroom.
Sunday, March 27, 2016
Business Modelings
Business ModelingSaturday, March 26, 2016
Control Charts for Variable and Attribute

There are two important control charts in statistical process control (SPC) such as control chart for variable and control chart for attribute.
On the other hand, attribute control chart is used to identify the defective/conforming and nondefective/nonconforming of a unit of product which these two classifications are called quality characteristics. In the process, we may examine a unit of product and count defects or nonconformities on the unit. Then, these attributes data show the number of defective or defects per sample, or proportion of the defective or defects per sample. Control limits are calculated by many ways depending on kind of control charts. Control chart for attribute include: control chart for fraction nonconforming(p chart); control chart number of nonconforming items(np chart); control chart for nonconformities(c chart); control chart for nonconformities per unit(u chart).
Before we
understand about variable chart, we must understand what the variable is.
Variable is the single measurable quality characteristic, such as dimension,
weight, and volume etcVariable
control chart is the simple and powerful tool for determining the process
whether it is in the control or out of control by looking at the
plot points. If they stay out of upper-control limit or lower control limit, it
means that the process is out of control. Control charts help you focus
problem-solving efforts by distinguishing between common and special-cause variation.
Then, we can improve on that point in order to make the process to be in the
control. In variable control
chart, we normally monitor with x bar control chart,
which is mean quality level, s control
chart, which is a control chart for the standard deviation,
and R control chart, which is a control chart for range. The x bar and R (or s)
charts are among the most important and useful on-line statistical process
monitoring and control techniques.
On the other hand, attribute control chart is used to identify the defective/conforming and nondefective/nonconforming of a unit of product which these two classifications are called quality characteristics. In the process, we may examine a unit of product and count defects or nonconformities on the unit. Then, these attributes data show the number of defective or defects per sample, or proportion of the defective or defects per sample. Control limits are calculated by many ways depending on kind of control charts. Control chart for attribute include: control chart for fraction nonconforming(p chart); control chart number of nonconforming items(np chart); control chart for nonconformities(c chart); control chart for nonconformities per unit(u chart).
Lean is Simple| Paul Akers
Lean is simplified by Paul Akers. He names himself as the American Innovator. He is an entrepreneur, business owner, author, and speaker and lean maniac. He has traveled around the world with thousand of ideas in lean to make thousand of improvements. In this video, he shared the presentation of Lean Journey with Lean Construction Institute. He gave many examples in real world. The awesome example is Lean Trucking.Minitab
MinitabFriday, March 25, 2016
How to calculate Defect Per Million Opportunities (DPMO)
DPMO is a common metric of Six Sigma. The DPMO is the ratio between the number of defects discovered and the number of opportunities for defects, multiplied by 1,000,000. For example, there are 3 processes to produce a pencil. Process 1 produces three defects, process 2 produces five defects, and process 3 produces one defect.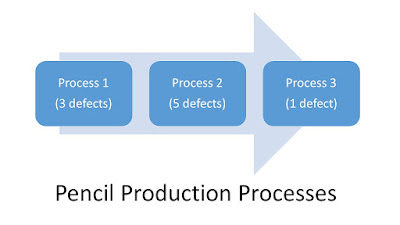
The output are 100 pencils and the DPMO is calculated like this:
Total number of defects= 3+5+1=9 defects
Opportunities of defects= 100*3=300
DPMO=(9/300)*1,000,000
DPMO=30,000
This number shows that there are 30,000 defects per millions.
Note that Six sigma initiative strives for 3.4 defects per millions.
Like and share:


